")
")
")
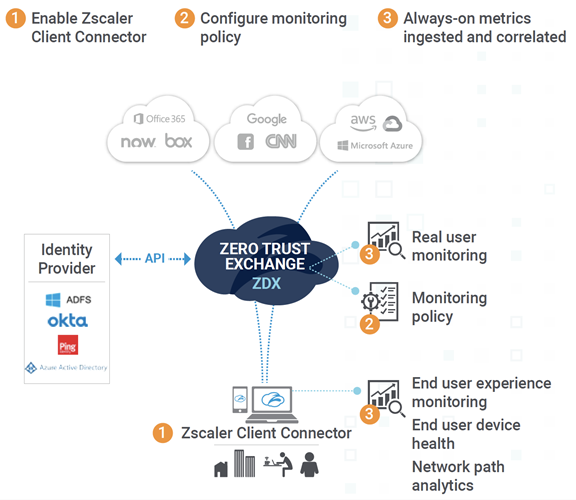
Zscaler ZDX Application Monitoring emerges as a robust solution, empowering organizations to proactively monitor, analyze, and optimize application performance across the network.
Key Features:
- Comprehensive Application Visibility:
- Gain deep insights into application traffic traversing the network.
- Identify and classify applications with precision to understand usage patterns.
- Performance Monitoring and Optimization:
- Monitor application performance metrics in real-time.
- Detect and troubleshoot performance bottlenecks swiftly to minimize downtime.
- Optimize application delivery for enhanced user experience.
- Security Insights:
- Detect anomalous behaviour and potential security threats within applications.
- Strengthen security posture with actionable insights derived from application monitoring data.
- Customizable Dashboards and Reports:
- Tailor dashboards to visualize key performance indicators aligned with business objectives.
- Generate detailed reports for compliance audits and executive insights.
Implementation Strategies:
- Assessment and Planning:
- Conduct a thorough assessment of existing application infrastructure and performance metrics.
- Define monitoring objectives and KPIs aligned with business goals.
- Deployment and Configuration:
- Deploy ZDX Application Monitoring agents strategically across the network.
- Configure monitoring policies and thresholds to align with organizational requirements.
- Training and Adoption:
- Provide comprehensive training to IT teams on utilizing ZDX Application Monitoring features effectively.
- Foster a culture of proactive application monitoring and optimization within the organization.
- Continuous Improvement:
- Regularly review monitoring data to identify trends and opportunities for optimization.
- Iterate on monitoring policies and configurations to adapt to evolving business needs.
Application Monitoring
To configure applications, we need to follow below steps:
- For Predefined apps:
- Go to the Configuration tab on the left-hand side of the ZDX UI.

- Select the appropriate predefined apps you want to enter the details like tenant ID onboard, and click Go.
- Probes will be auto-configured for predefined apps.
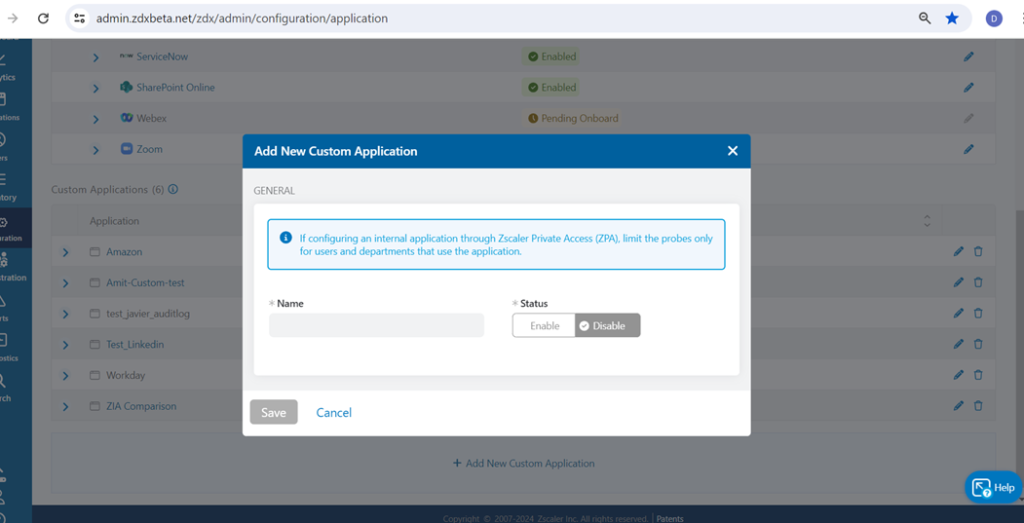
- For Custom apps:
- Go to the Configuration tab on the left-hand side of the ZDX UI.
- Click on “Add New Custom Applications”, add details, and save.
From the top of the page, click on Probes and then find the application which you created.
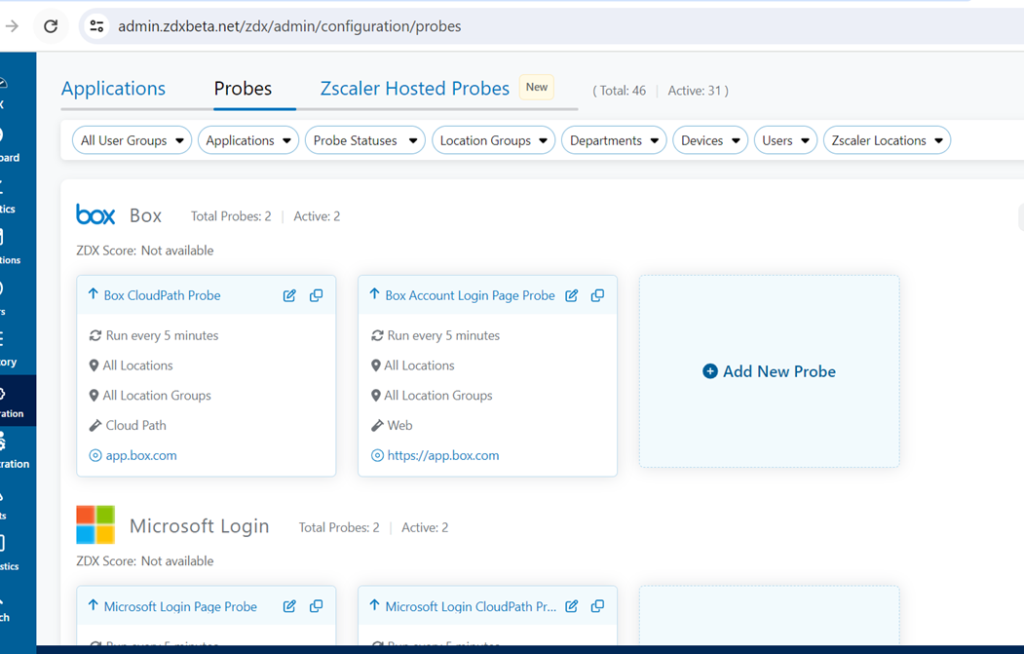
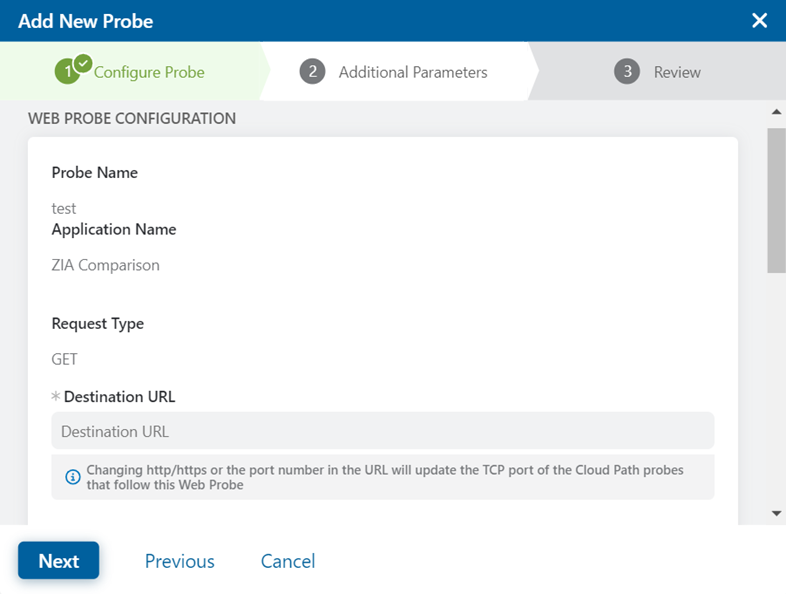
To create Web Probe, add the details as requested in the tab. For example: Name and Destination URL and save.
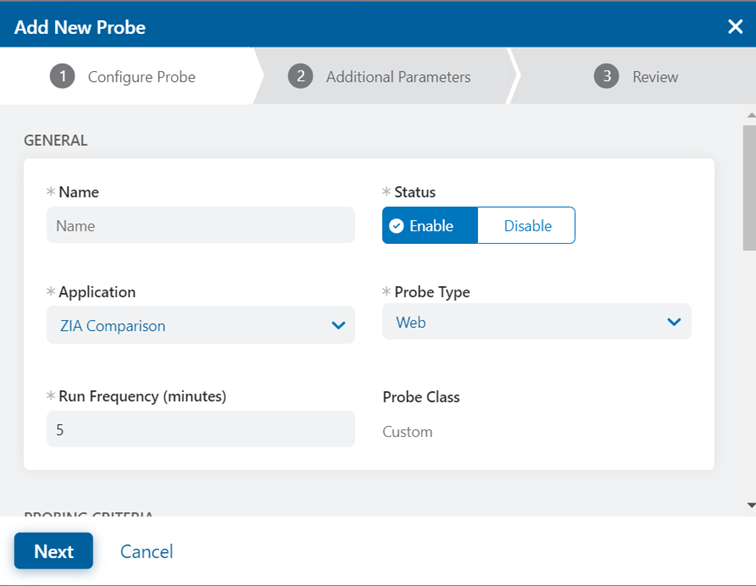
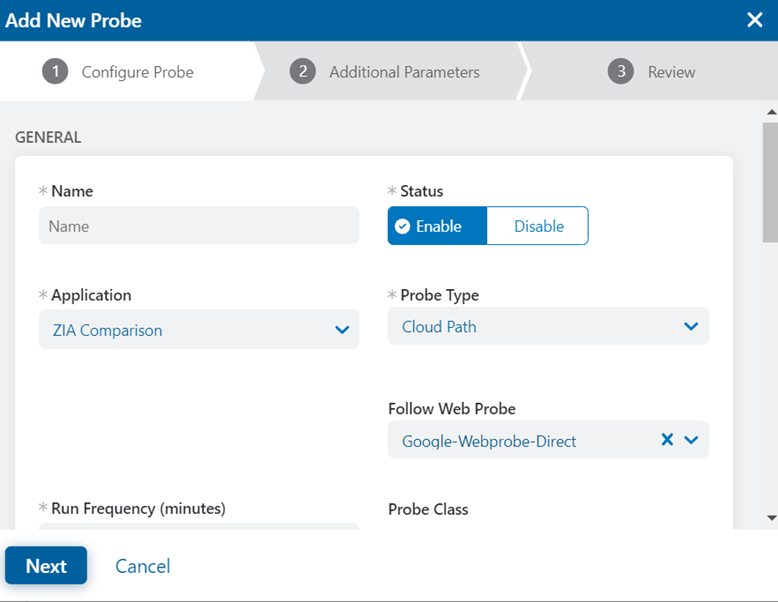
To create Cloud path probe, select the probe type as “Cloud Path” and the web probe for that application which it should follow.
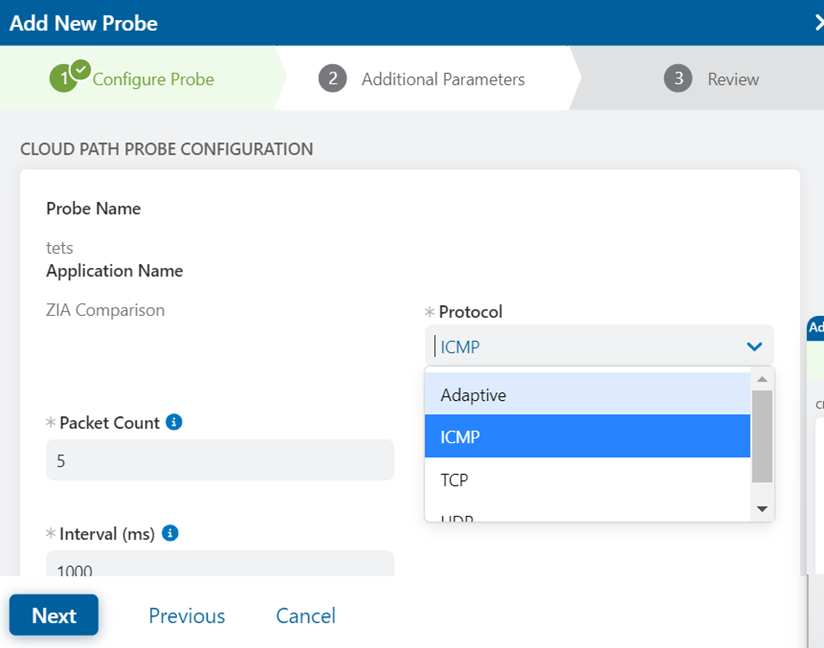
Select the protocol it should use to establish the connection. If you are unsure, select Adaptive (it chooses the best possible protocol).
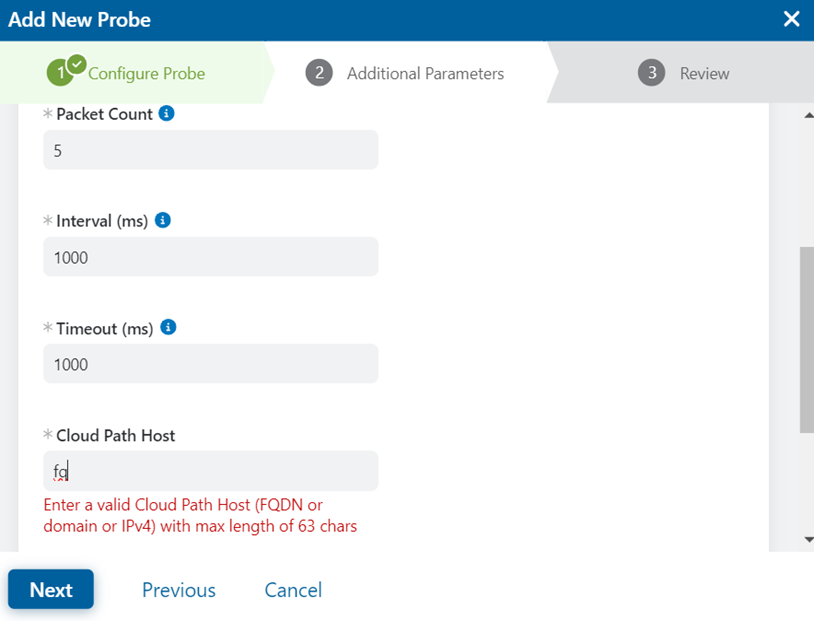
Enter a valid Cloud path host on the detail box below and save.
Zscaler ZDX Application Monitoring empowers enterprises to achieve unparalleled visibility, performance optimization, and security insights for their critical applications. By leveraging this powerful solution, organizations can proactively address performance challenges, enhance user experiences, and strengthen their overall security posture in today’s dynamic digital landscape.

Tech Enthusiast & Knowledge Sharer
I am a passionate technologist dedicated to demystifying the world of networking, cloud computing, and automation. Focusing on simplicity and practicality.
I believe in breaking down complex concepts into understandable and actionable insights.